Using Python Dash to Develop Data Applications for the Web
- UUID: 452ad080-021a-466b-bccc-5ccfdd4e987c
- Timestamps
- 20240206.Added this article
What is Dash?
Dash is:
- A product made by Plotly to make using Plotly.js and Plotly.py easier for the web.
- An integrated solution for data visulization on the web
- encompasses Flask (including Jinjia2 etc.), Plotly.py as well as Plotly.js
What is An App on Dash Look Like?
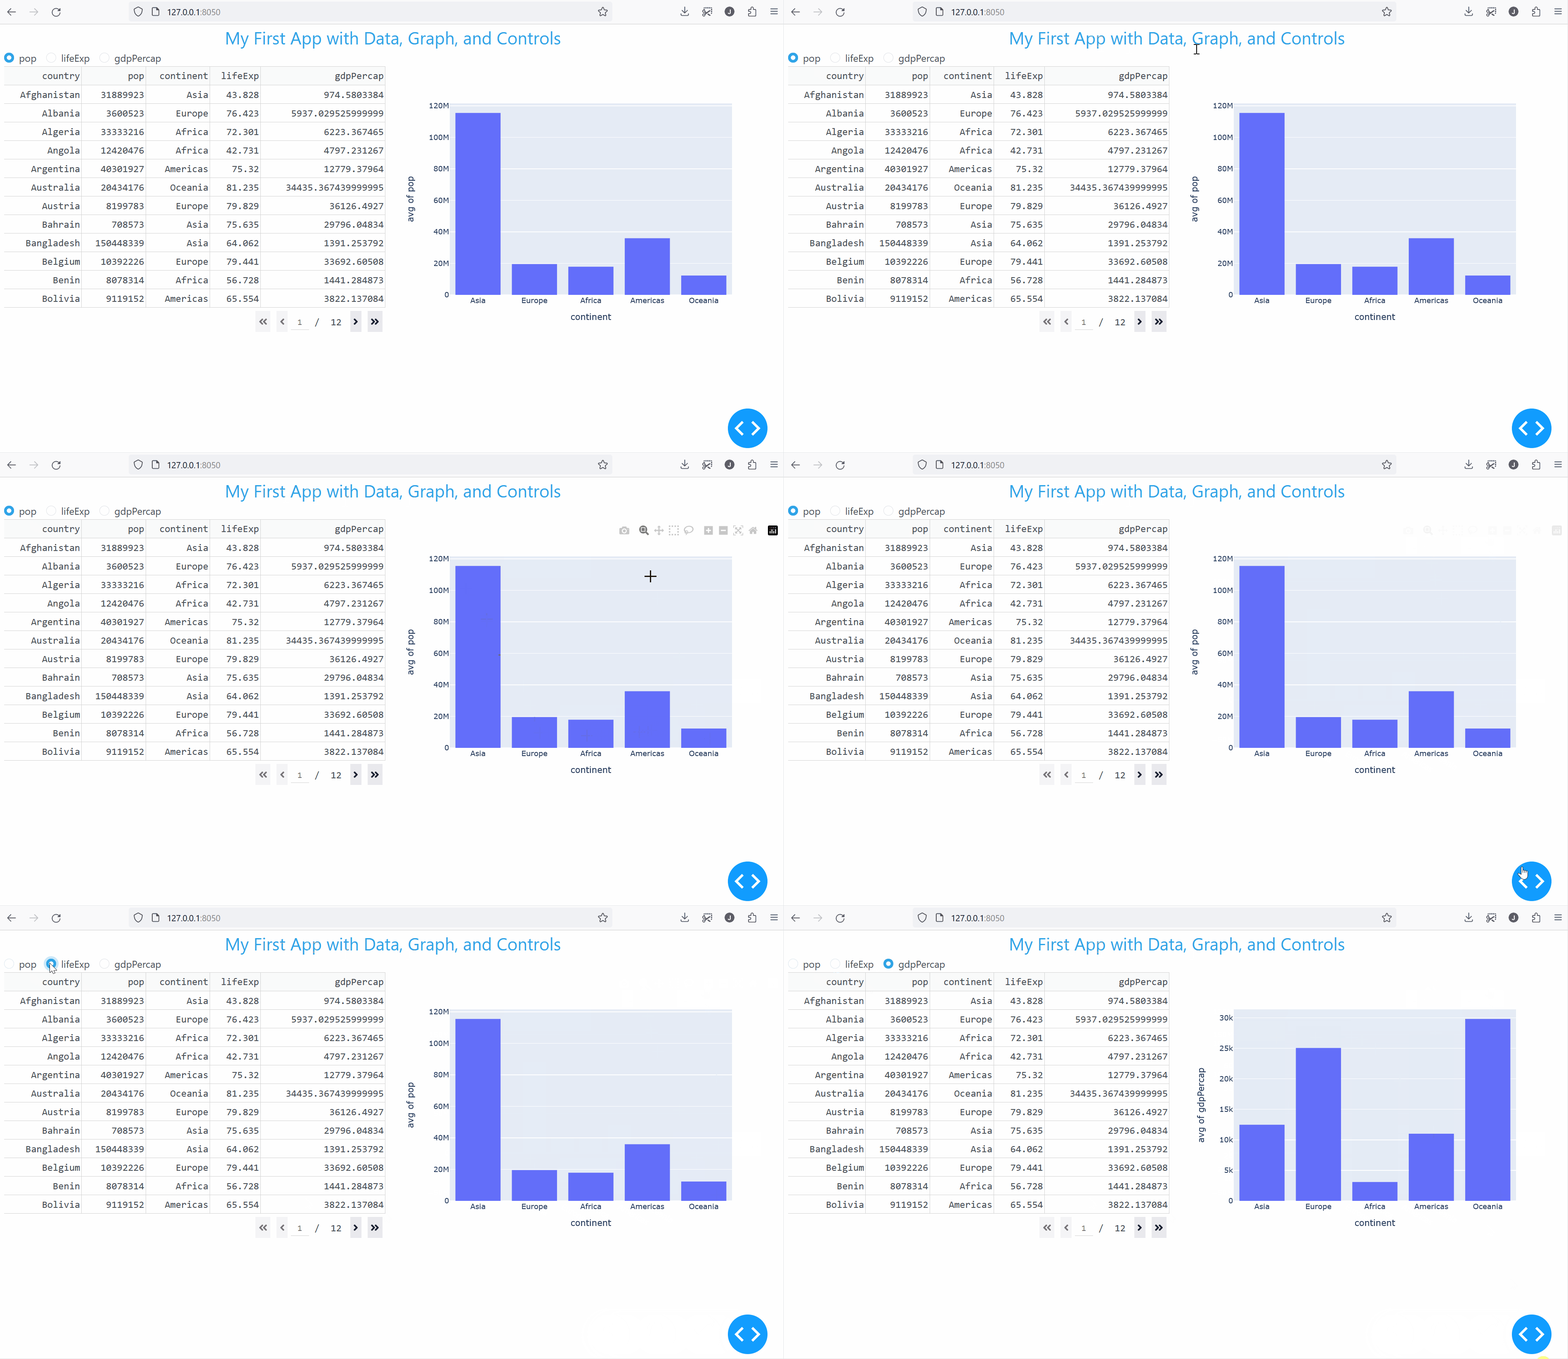
Following the official tutorial Dash in 20 Minutes provided by Plotly, an app as the following can be easily made.

import pandas as pd

from dash import Dash, html, dash_table, dcc, callback, Output, Input
import plotly.express as px

import dash_bootstrap_components as dbc


df = pd.read_csv('data/gapminder2007.csv')

external_stylesheets = [dbc.themes.CERULEAN]
app = Dash(__name__, external_stylesheets=external_stylesheets)

app.layout = dbc.Container([
    dbc.Row([
        html.Div('My First App with Data, Graph, and Controls', className='text-primary text-center fs-3')
    ]),
    dbc.Row([
        dbc.RadioItems(options=[{'label': x, 'value': x} for x in ['pop', 'lifeExp', 'gdpPercap']],
                       value='lifeExp',
                       inline=True,
                       id='radio-buttons-final')
    ]),
    dbc.Row([
        dbc.Col([
            dash_table.DataTable(data=df.to_dict('records'), page_size=12, style_table={'overflowX': 'auto'})
        ], width=6),

        dbc.Col([
            dcc.Graph(figure={}, id='my-first-graph-final')
        ], width=6),
    ]),

], fluid=True)

@callback(
    Output(component_id='my-first-graph-final', component_property='figure'),
    Input(component_id='radio-buttons-final', component_property='value')
)
def update_graph(col_chosen):
    fig = px.histogram(df, x='continent', y=col_chosen, histfunc='avg')
    return fig

if __name__ == '__main__':
    app.run(debug=True)
The application code and more related files I have made are also available at https://github.com/johannhuang/Trying.Dash.
Should I Use Dash?
In case you are like me who has experience in lower level technologies under the hood of Dash, viz., Flask, Plotly.js, HTTP as well as WebSocket, fundamentally, Dash is not needed.
Example of using Flask with Plotly.js is directly on this website (as it is powered by Flask under the hood), such as at Data and Visualization of Making My PONS Dictionary which uses Plotly.js for interactive data visulization. (Therefore, the combined use of Flask and Plotly.js just like Dash.)
But for convinience and efficiency, curated solution like Dash would be a very good choice to adopt.Let alone the performance and security curating beyond the application level frontend and backend communication handling!
* cached version, generated at 2024-04-24 11:24:10 UTC.
Subscribe by RSS